Life's a garden. Dig it.
Challenge
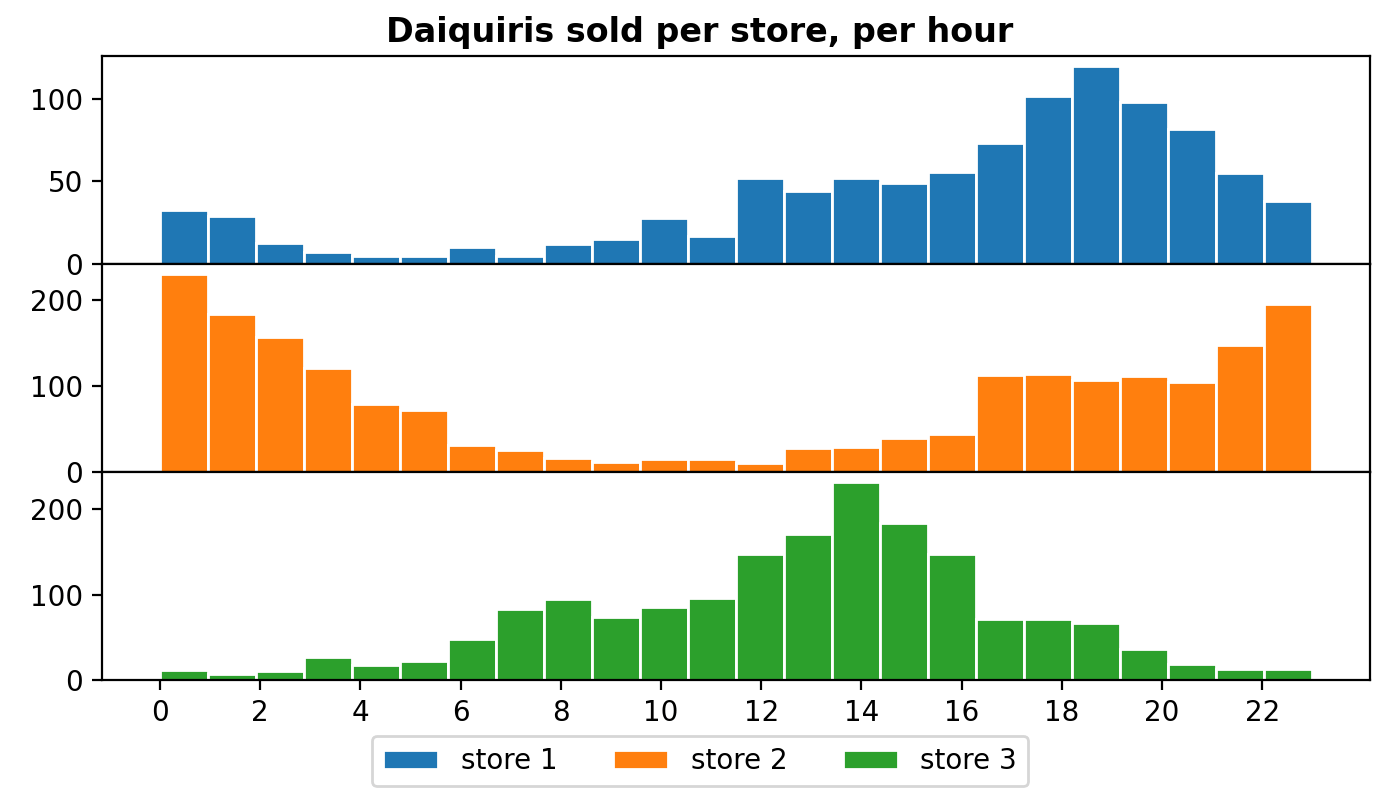
You own a chain of drive-thru daiquiris 🥤. (Yes, they exist.) Build a plot like the one below showing the distribution of sales per store, per hour.
import numpy as np

rng = np.random.default_rng(1234)

p1 = [0.05, 0.03, 0.02, 0.01, 0.01, 0.01, 0.01, 0.01, 0.02, 0.02, 0.03, 0.04,
      0.07, 0.07, 0.08, 0.08, 0.08, 0.12, 0.15, 0.18, 0.15, 0.12, 0.08, 0.06]
p2 = np.concatenate((p1[-5:], p1[:-5]))
p3 = np.concatenate((p1[5:], p1[:5]))

# sales per store
s1 = rng.choice(24, size=1000, replace=True, p=p1/np.sum(p1))
s2 = rng.choice(24, size=2000, replace=True, p=p2/np.sum(p2))
s3 = rng.choice(24, size=1750, replace=True, p=p3/np.sum(p3))

print(s1[:5]) # [23 16 22 13 14]
print(s2[:5]) # [22 17 11 22  0]
print(s3[:5]) # [16 7 12 15 17]Show the plot
Solution
This content is gated
Subscribe to the product below to gain access