Life's a garden. Dig it.
Challenge
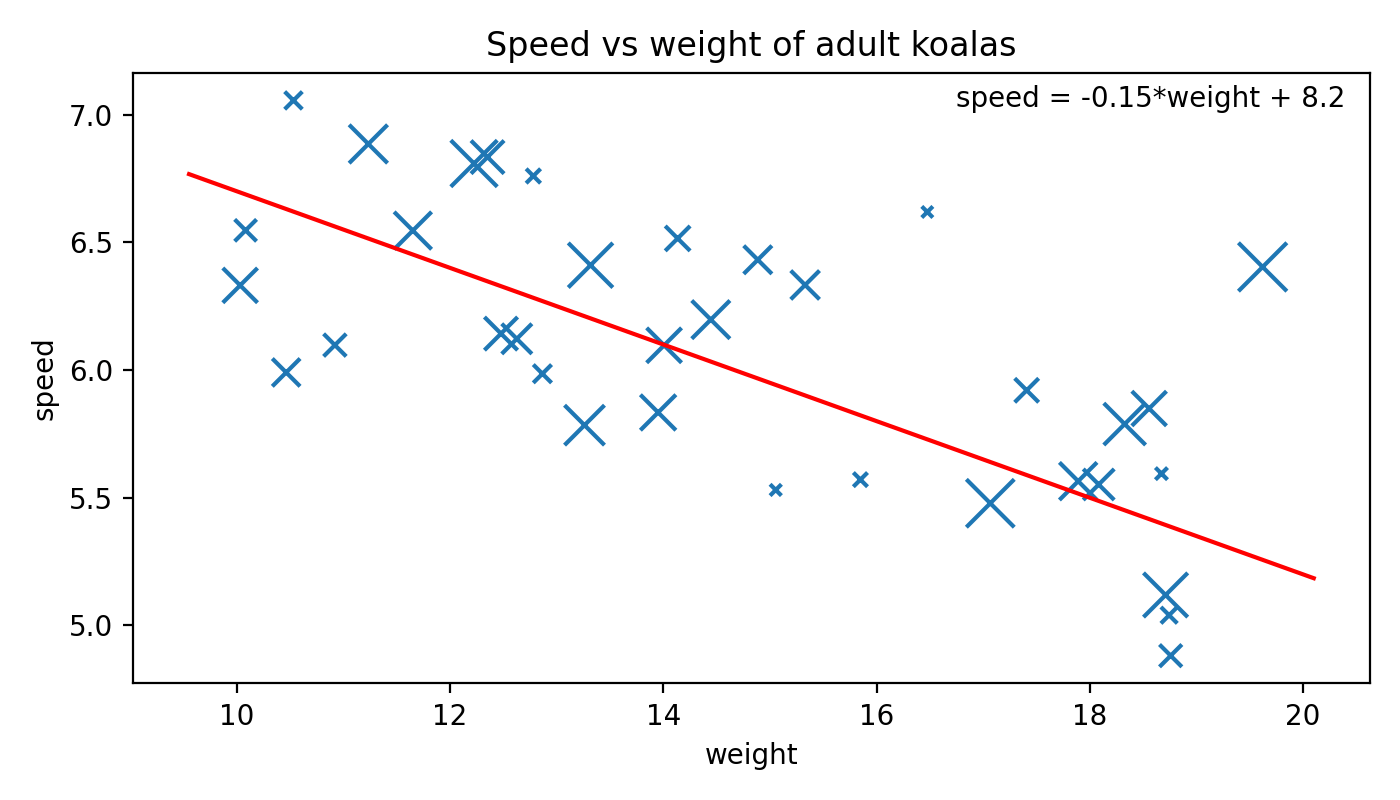
You believe there's a linear relationship between the weight of an adult koala 🐨 and how fast it runs. You gather some data.
import numpy as np

# Create a random number generator
rng = np.random.default_rng(4321) # (1)!

# Make data
weights = rng.uniform(low=10, high=20, size=35)
speeds =  -0.08* weights + 7.2 + rng.normal(loc=0, scale=0.5, size=len(weights))
ages = rng.uniform(low=3, high=18, size=len(weights))

print(weights)  # [10.03 18.08 15.33 ... 17.07 13.32 10.08]
print(speeds)   # [6.33 5.55 6.33 ... 5.48 6.41 6.55]
print(ages) # [12.51 11.16 10.36 ... 17.24 16.06 7.89]You fit a linear regression model to this data, y = mx + b, with slope m = -0.15 and offset b = 8.2.
- Make a scatter plot of speed (y) vs weight (x), varying the size of each point by the koala's age.
- Overlay the linear regression line defined by
mandb. - Include the linear regression equation inside the Axes, near the top right. (Make the position of the equation independent of the data!)
Show the plot
Solution
This content is gated
Subscribe to the product below to gain access